← All analytics projects
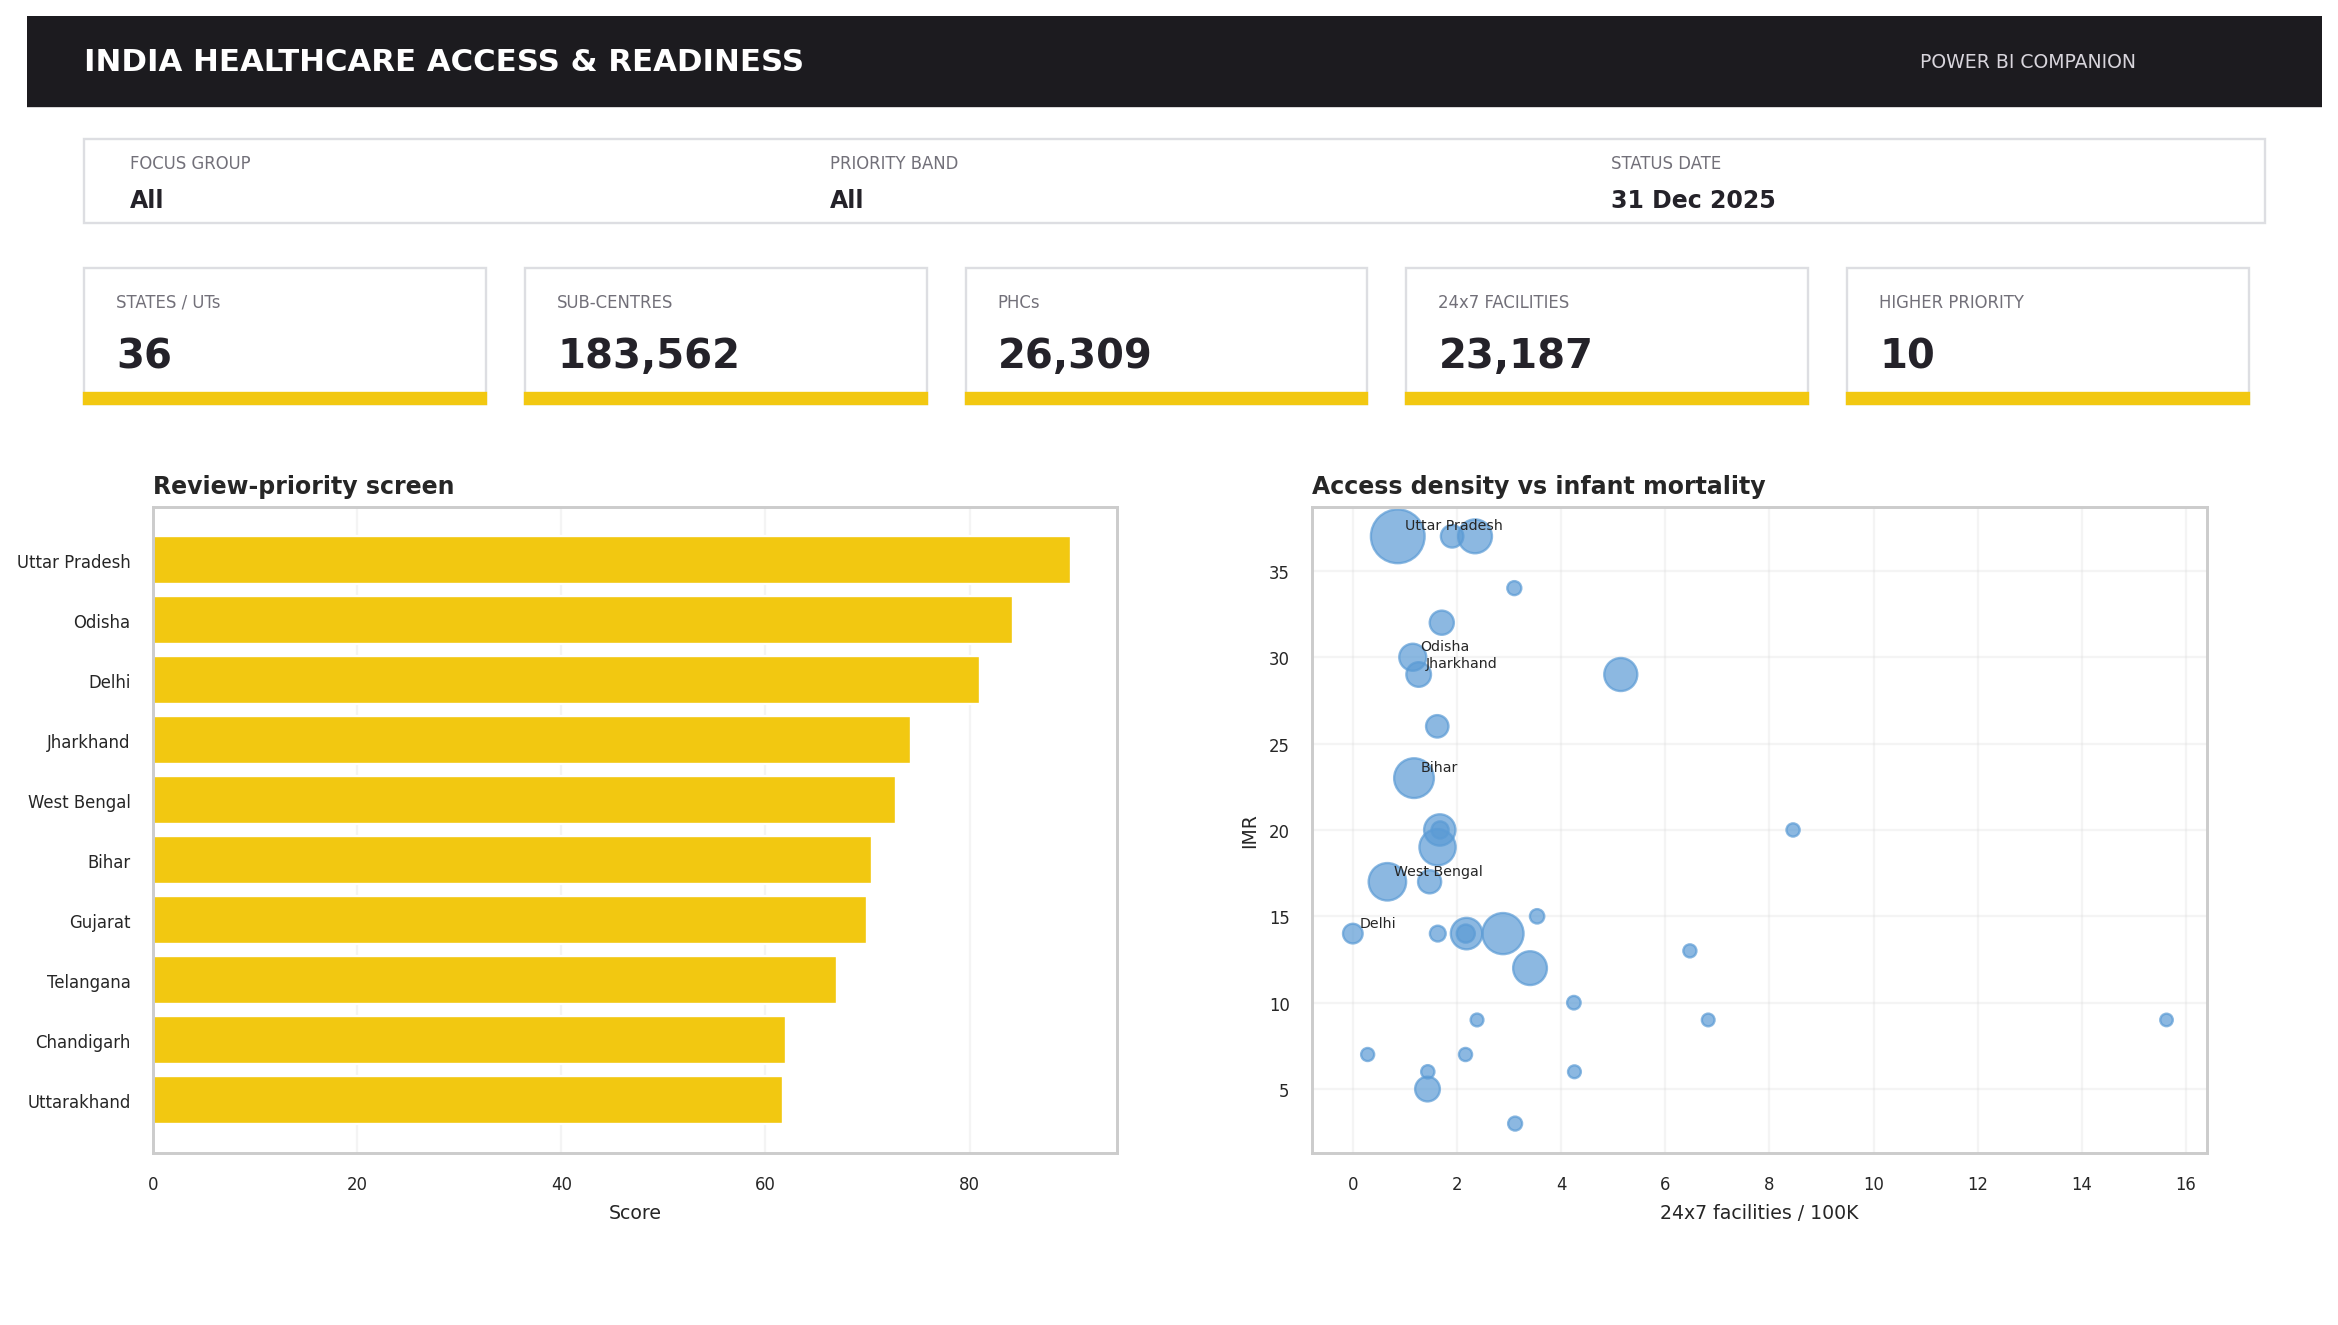
Power BI companion layout target; not a hosted report.
07
Project 07 · Public-health operations & DuckDB
Healthcare Access & Readiness
Turn official NHM quarterly MIS reports into transparent state-level access, staffing, mapping, outcome, and data-quality review signals.
HealthcareDuckDBPublic data36 states & UTs
States & UTs36
Sub-centres183,562
PHCs26,309
CHCs6,388
District hospitals784
Reported 24x723,187
National overview
Separate access signals from source limitations
Reported facility footprint
NHM focus groups
| Focus group | States/UTs | PHCs | Median IMR | Median priority |
|---|---|---|---|---|
| High Focus - NE | 8 | 1,624 | 14.0 | 41.5 |
| High Focus - Non-NE | 10 | 12,614 | 29.0 | 61.5 |
| Non-High Focus - Large | 11 | 11,956 | 17.0 | 55.7 |
| Non-High Focus - Small & UT | 7 | 115 | 9.0 | 31.9 |
Median urban mapping100.0%
Median PHC readiness42.6%
Median reported IMR14.5
Higher-priority states/UTs10
State explorer
Filter states while keeping completeness visible
Review filters
Selected states/UTs36
Selected PHCs26,309
Selected CHCs6,388
Median readiness42.6%
Median completeness93.8%
36 selected states/UTs
Current filter: 36 states/UTs
| State / UT | Focus | PHCs | 24x7 / 100K | PHC readiness | IMR | Priority | Band | Complete |
|---|---|---|---|---|---|---|---|---|
| Uttar Pradesh | High Focus - Non-NE | 3,032 | 0.86 | 5.4% | 37.0 | 90.0 | Higher review priority | 100% |
| Odisha | High Focus - Non-NE | 1,290 | 1.15 | 6.0% | 30.0 | 84.3 | Higher review priority | 100% |
| Delhi | Non-High Focus - Small & UT | 0 | 0.00 | — | 14.0 | 81.0 | Higher review priority | 75% |
| Jharkhand | High Focus - Non-NE | 332 | 1.26 | 0.0% | 29.0 | 74.3 | Higher review priority | 100% |
| West Bengal | Non-High Focus - Large | 906 | 0.66 | 25.3% | 17.0 | 72.8 | Higher review priority | 100% |
| Bihar | High Focus - Non-NE | 1,690 | 1.17 | 6.2% | 23.0 | 70.4 | Higher review priority | 100% |
| Gujarat | Non-High Focus - Large | 1,523 | 1.67 | 10.3% | 20.0 | 69.9 | Higher review priority | 100% |
| Telangana | Non-High Focus - Large | 881 | — | 37.0% | 18.0 | 67.0 | Higher review priority | 75% |
| Chandigarh | Non-High Focus - Small & UT | 5 | 0.28 | 0.0% | 7.0 | 62.0 | Higher review priority | 63% |
| Uttarakhand | High Focus - Non-NE | 575 | 1.68 | 7.0% | 20.0 | 61.7 | Higher review priority | 100% |
| Madhya Pradesh | High Focus - Non-NE | 1,442 | 2.35 | 14.1% | 37.0 | 61.4 | Moderate review priority | 100% |
| Kerala | Non-High Focus - Large | 849 | 1.43 | 33.3% | 5.0 | 59.1 | Moderate review priority | 100% |
| Chhattisgarh | High Focus - Non-NE | 765 | 1.91 | 45.5% | 37.0 | 58.6 | Moderate review priority | 100% |
| Assam | High Focus - NE | 957 | 1.71 | 42.6% | 32.0 | 58.0 | Moderate review priority | 100% |
| Haryana | Non-High Focus - Large | 407 | 1.62 | 54.5% | 26.0 | 56.0 | Moderate review priority | 100% |
| Karnataka | Non-High Focus - Large | 2,160 | 2.18 | 23.2% | 14.0 | 55.7 | Moderate review priority | 100% |
| Punjab | Non-High Focus - Large | 421 | 1.47 | 49.9% | 17.0 | 53.0 | Moderate review priority | 100% |
| Himachal Pradesh | High Focus - Non-NE | 581 | 1.63 | 0.0% | 14.0 | 52.3 | Moderate review priority | 88% |
| Jammu & Kashmir | High Focus - Non-NE | 373 | 2.17 | 17.7% | 14.0 | 48.9 | Moderate review priority | 88% |
| Arunachal Pradesh | High Focus - NE | 143 | 8.45 | 62.2% | 20.0 | 48.8 | Moderate review priority | 63% |
| Meghalaya | High Focus - NE | 115 | 3.10 | 64.3% | 34.0 | 47.8 | Moderate review priority | 63% |
| Maharashtra | Non-High Focus - Large | 2,198 | 2.88 | 13.6% | 14.0 | 47.4 | Moderate review priority | 100% |
| Andhra Pradesh | Non-High Focus - Large | 1,144 | 1.63 | 100.0% | 19.0 | 43.2 | Lower review priority | 100% |
| Rajasthan | High Focus - Non-NE | 2,534 | 5.15 | 59.3% | 29.0 | 42.4 | Lower review priority | 100% |
| Goa | Non-High Focus - Large | 24 | 1.44 | 54.2% | 6.0 | 41.9 | Lower review priority | 63% |
| Nagaland | High Focus - NE | 131 | 4.24 | 9.2% | 10.0 | 41.7 | Lower review priority | 63% |
| Tamil Nadu | Non-High Focus - Large | 1,443 | 3.40 | 91.1% | 12.0 | 41.4 | Lower review priority | 100% |
| Mizoram | High Focus - NE | 57 | 6.47 | 84.2% | 13.0 | 41.3 | Lower review priority | 63% |
| Andaman & Nicobar Islands | Non-High Focus - Small & UT | 22 | 6.82 | 90.9% | 9.0 | 36.7 | Lower review priority | 63% |
| Tripura | High Focus - NE | 111 | 3.54 | 84.7% | 15.0 | 33.0 | Lower review priority | 63% |
| Ladakh | Non-High Focus - Small & UT | 32 | — | 37.5% | 4.0 | 31.9 | Lower review priority | 38% |
| Dadra & Nagar Haveli and Daman & Diu | Non-High Focus - Small & UT | 13 | 2.39 | 84.6% | 9.0 | 30.5 | Lower review priority | 63% |
| Puducherry | Non-High Focus - Small & UT | 39 | 2.16 | 87.2% | 7.0 | 30.2 | Lower review priority | 63% |
| Manipur | High Focus - NE | 86 | 3.12 | 70.9% | 3.0 | 24.1 | Lower review priority | 63% |
| Sikkim | High Focus - NE | 24 | 4.26 | 100.0% | 6.0 | 17.9 | Lower review priority | 63% |
| Lakshadweep | Non-High Focus - Small & UT | 4 | 15.63 | 100.0% | 9.0 | 11.2 | Lower review priority | 50% |
Access and outcomes
Describe the relationship without claiming causation
24x7 access density and infant mortality
Circle size represents reported population · hover for state values
States in scatter34
Correlation-0.21
Rate exclusions2
Review planner
Composite, completeness-aware priority screen
Top 20 review-priority scores
Methods and Power BI
Quality checks, metric definitions, and companion files
Data quality
| Check | Issues | Status |
|---|---|---|
| parsed_state_ut_rows | 36 | PASS |
| duplicate_state_rows | 0 | PASS |
| missing_or_zero_population_rows | 2 | REVIEW |
| missing_imr_rows | 0 | PASS |
| missing_mmr_rows | 17 | REVIEW |
| urban_mapping_above_100_pct_rows | 1 | REVIEW |
| phc_staffing_above_100_pct_rows | 0 | PASS |
| insufficient_priority_component_rows | 0 | PASS |
| negative_facility_count_cells | 0 | PASS |
Metric dictionary
| Metric | Unit | Boundary |
|---|---|---|
| urban_facility_mapping_pct | % | Higher is better; values over 100 are retained source inconsistencies |
| phc_three_nurse_readiness_pct | % | Staffing readiness proxy, not full workforce adequacy |
| facilities_24x7_per_100k | rate | Uses dated population and does not measure beds, staffing quality, or travel time |
| district_hospitals_per_million | rate | Facility count does not measure beds, quality, or travel time |
| imr | per 1,000 live births | Missing for some states/UTs |
| review_priority_score | 0-100 | Screening index only; requires at least three components |